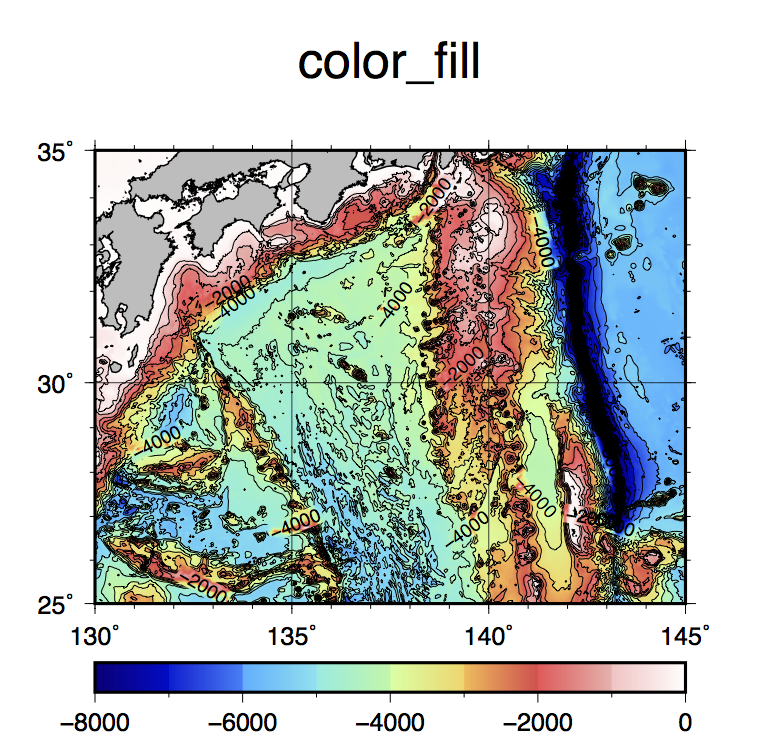
color filled contour map 1 - 彩色した図と等深線を重ねる(グラデーション) 
 使うコマンド makecpt, grdimage, grdcontour, psscale, pscoast psbasemap
bash スクリプト例
# plot bathymetry color fill map
# parameter setting
region=130/145/25/35
# map region east/west/south/north
proj=M10
# map projection and scale
ticks=a5f1g5
# boundary tick info
frame=WSne+tcolor_fill
# boundary frame info
climit=-8000/0/1000
# color table min/max/interval
cint=500
# contour interval
limit=-10000/-500
# contour min/max
aint=2000
# annotation contour interval
grdfile=JTOPO1_30.grd
# input bathymetry grid file
cptfile=haxby_grad.cpt
# color table
psfile=colfilcnt.ps
# output postscript file name
#
# making color table
gmt makecpt -Chaxby -T$climit -Z > $cptfile
#
# plot
gmt grdimage $grdfile -R$region -J$proj -C$cptfile -K -V > $psfile
gmt grdcontour $grdfile -R$region -J$proj -C$cint -A$aint -L$limit -K -V -O >> $psfile
gmt psscale -D5/-1/10/0.5h -C$cptfile -Bf1000a2000 -K -O >> $psfile
gmt pscoast -R$region -J$proj -Di -Ggray -Wthin,black -K -V -O >> $psfile
gmt psbasemap -R$region -J$proj -B$ticks -B$frame -O -V >> $psfile
Tips
- psscaleのスケールバーを横置きにした場合(hをつける)。スケールバーのアノテーションはcptファイルの行に対応して煩雑すぎることが多いので-Bオプションで明示的につける
- makecptコマンドで-Zオプションをつけると、カラーテーブルの色は滑らかに変化する